Our friends at John Burns Real Estate Consulting shared some great insights for business owners in any industry.
We gave each decade a name based on the biggest demographic shift they led.
- 1930s Savers shifted society to save more
- 1940s Achievers began a decades-long shift toward achieving greater financial wealth
- 1950s Innovator. Your generation created many of the most important technological and other innovations that have changed the world.
- 1960s Equalers pushed for more equal opportunities in the world
- 1970s Balancers redefined success to include more balance in work and home, particularly after 9/11
- 1980s Sharers invented the Sharing economy, taking advantage of new technologies to be more efficient in tough economic times
- 1990s Connectors led society’s shift to be more wirelessly connected via smartphone
- 2000s Globals grow up today more globally aware and with more internationally-connected friends
The 1990s Connector generation has the most people living in the US today.
44.1 million Americans were born in the 1990s, including 4.2 million who were born in another country. They are 17-26 years old today.
If the number of children born per woman had stayed the same as it was in 1960, when the birth control pill was approved, 260 Million more people would live in the U.S. today. (330 million people currently live in the US.)
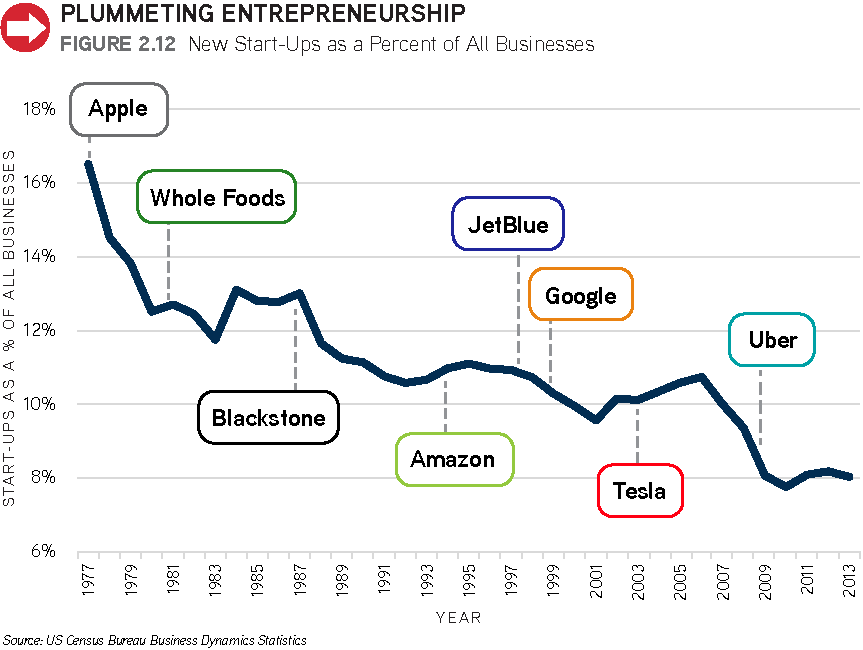
When 1950s Innovators Bill Gates and Steve Jobs started their companies, 16% of all US businesses were startups. Today As seen in the graph below only 8% of businesses are start-ups.

23% of all married couples both have college degrees, almost twice the percentage as in 1990 and clearly rising since the growth is skewed to younger couples.
About 40% of children under age 1 are being raised by unmarried parents. In almost 1/3 of these cases, the unmarried parents are raising the child together in the same household, so 26% of children under age 1 are being raised by only one parent.
32% of US households with children are headed by a single parent.
8.1% of Americans live in zip codes in the 50 largest cities in the country whose homes were typically built before World War II, have at least 7,500 people per square mile, and where 20% use public transit, bike or walk to work. 64% of Americans live in a suburban environment.
By 2025, we expect 66 million Americans to be 65 or better compared to 48 million in 2015, more than half of them born in the 1950s.
11% of Americans move every year, which is an average of one move every 9 years. Homeowners move about half as often as they did in the 1980s and renters about a third as often.
Texas has the highest projected population growth in the next decade. The population of Texas is projected to grow 24% from 2016 to 2025.
For insights on where our economy is heading get on the list to receive our quarterly economic report by emailing us @ info@hiscapitalgroup.com and type in send economic report in the subject line.


Thank you, your article surprised me, there is such an excellent point of view. Thank you for sharing, I learned a lot.
Thank you for your sharing. I am worried that I lack creative ideas. It is your article that makes me full of hope. Thank you. But, I have a question, can you help me?
Nice post. I learn something totally new and challenging on websites
I truly appreciate your technique of writing a blog. I added it to my bookmark site list and will
Hi there to all, for the reason that I am genuinely keen of reading this website’s post to be updated on a regular basis. It carries pleasant stuff.
Great information shared.. really enjoyed reading this post thank you author for sharing this post .. appreciated
I’m often to blogging and i really appreciate your content. The article has actually peaks my interest. I’m going to bookmark your web site and maintain checking for brand spanking new information.
This helped me a lot, thank you.
I felt like this was written just for me.
You’ve made a complex topic simple.
This was very enlightening.
This answered all my questions.
Good post! We will be linking to this particularly great post on our site. Keep up the great writing
Thanks for making it so relatable.
Thanks for sharing this insightful article.
Loved the tone and clarity.
Thanks for making it so relatable.
Super insightful and fresh perspective.
Pretty! This has been a really wonderful post. Many thanks for providing these details.
This content stands out from the rest.
This is going to help so many people.